Separating Narrative from Infrastructure
The term "ETH Conspiracy" often triggers immediate skepticism. In the crypto space, it usually refers to baseless rumors about centralization or hidden agendas. However, in this guide, we use the phrase differently. We are not discussing literal plots. We are analyzing how complex market narratives can obscure the actual technical and structural shifts happening in Ethereum’s infrastructure.
To build a reliable 2026 outlook, we must strip away the sensationalism. The Ethereum ecosystem is driven by code, consensus mechanisms, and developer activity—not secret cabals. By focusing on verifiable data points like protocol upgrades, layer-2 adoption, and governance changes, we can separate signal from noise. This analytical approach allows us to assess the network’s true health and trajectory without getting lost in speculative fiction.
The goal here is clarity. We will examine the fundamental layers of Ethereum—its base layer, scaling solutions, and economic incentives. Understanding these mechanics provides a stable foundation for decision-making, far more valuable than chasing viral headlines or unfounded theories.
Tracking Layer Two Infrastructure Shifts
Price charts tell you what the market is feeling right now. They do not tell you if the network is actually working. To separate signal from noise, you need to monitor the underlying infrastructure: rollup throughput, sequencer reliability, and data availability costs.
When Layer 2s struggle to post data or sequencers go offline, transaction fees spike and finality delays. These are the early warning signs of network stress, long before they appear on a price chart. By tracking these metrics, you can assess the health of the Ethereum ecosystem based on utility, not speculation.
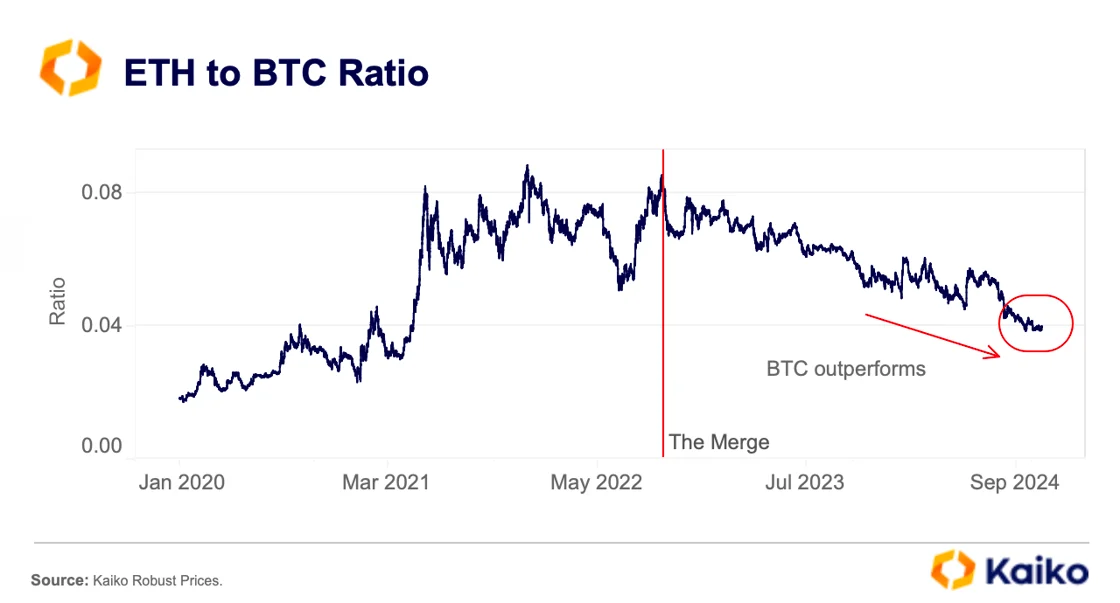
The ETH/BTC ratio often lags behind these infrastructure shifts. As Kaiko notes, Ethereum can lag behind Bitcoin in market performance while its underlying Layer 2 activity grows. This divergence highlights the importance of looking at on-chain data rather than just price action.
What to Monitor
Sequencer Uptime and Latency Most Layer 2s use centralized sequencers to order transactions. If a sequencer goes down, users cannot send or receive funds. Check official status pages for your preferred L2 (like Arbitrum, Optimism, or Base) to track real-time uptime. High latency or frequent outages indicate a fragile infrastructure layer.
Data Availability (DA) Costs Rollups post compressed transaction data to Ethereum mainnet. If DA costs rise significantly, it often means network congestion or a shift in pricing models. Monitor the cost per byte of data posted. A steady increase in DA costs can squeeze L2 profitability and lead to higher fees for users.
Rollup TVL and Transaction Volume Total Value Locked (TVL) and daily active addresses show how much capital and usage the L2s are attracting. Compare these metrics across different L2s. A rise in TVL without a corresponding rise in transaction volume might indicate speculative activity rather than genuine utility.
Contextualizing Market Sentiment
While you monitor infrastructure, it helps to keep an eye on the broader market context. The following chart shows ETH/USD price action, which can help you correlate infrastructure news with market sentiment.
Applying Strategic Tools for Research
Understanding the Ethereum network in 2026 requires moving past price speculation and focusing on the underlying infrastructure. The "conspiracy" here is simply that the most valuable signals are hidden in plain sight, buried under layers of complex on-chain data. To cut through the noise, you need a toolkit that measures actual usage, not just sentiment.
Start by tracking developer activity. This is the most reliable leading indicator of long-term network health. A surge in GitHub commits or new protocol upgrades often precedes significant market movements. Tools like CryptoLabs or GitHub itself allow you to monitor which teams are building and how much code is being pushed to mainnet. If developers are leaving, the network is rotting from the inside, regardless of what the price chart says.
Next, evaluate Layer 2 (L2) ecosystem health. The Ethereum narrative has shifted from a single chain to a modular stack. You need to compare the major L2s side-by-side to see where liquidity and users are actually flowing. Don't just look at Total Value Locked (TVL); that metric can be manipulated by a few large whale wallets. Instead, focus on active addresses and transaction costs.
| Metric | Ethereum L1 | Optimism | Arbitrum |
|---|---|---|---|
| Avg. Gas Cost (USD) | $2.50 | $0.05 | $0.02 |
| Daily Active Addresses | 450,000 | 180,000 | 320,000 |
| Monthly Tx Volume | 95M | 45M | 85M |
This table highlights the stark contrast between base layer security and L2 efficiency. Arbitrum often leads in active users, while Optimism offers a more cost-effective environment for smaller transactions. These numbers tell you where the real economic activity is happening. If you are tracking infrastructure, you are tracking these flows, not the daily candle close.
Finally, use a provider-backed chart to contextualize these metrics against price action. This isn't about predicting the next pump; it's about verifying that fundamental growth is supporting the asset's valuation. A disconnect between rising developer activity and falling price can signal a temporary market inefficiency or a deeper structural issue. Use the TechnicalChart below to visualize the current momentum of the underlying asset while you analyze the on-chain data.
For those who prefer to study these concepts in a structured way, the following resources provide a solid foundation for understanding crypto infrastructure analysis.


As an Amazon Associate, we may earn from qualifying purchases.
By combining these strategic tools, you build a research framework that is resilient to market noise. You stop guessing and start measuring.
Avoiding Common Market Noise Traps
The Ethereum ecosystem is complex enough without adding the distortion of unverified rumors. Market noise often masquerades as insider knowledge, particularly regarding protocol upgrades or foundation activities. Distinguishing between genuine infrastructure developments and speculative fiction requires a disciplined approach to source verification.
One prevalent myth involves the Ethereum Foundation’s governance and funding. Claims that Vitalik Buterin or the Foundation operates as a centralized entity with hidden agendas frequently circulate on social media. These narratives often ignore the decentralized nature of the core developer community and the transparent nature of foundation grants. As Buterin himself has addressed, such conspiracy theories often stem from a misunderstanding of how open-source software development actually functions. Relying on official channels, such as the Ethereum Foundation’s blog or core developer calls, provides a clearer picture than anonymous leaks.
Another common trap is the misinterpretation of short-term price movements as evidence of long-term strategic shifts. Price manipulation narratives often ignore the underlying technical metrics, such as gas fees, transaction throughput, and validator activity. These metrics are the true indicators of network health and adoption. Focusing on price action alone is like judging a car’s engine by the sound of its exhaust; it misses the mechanical reality.
To navigate this landscape, verify every significant claim against primary sources. Check the Ethereum Improvement Proposal (EIP) repository for technical changes. Look for announcements on official Ethereum social channels. If a "leak" about a major upgrade or partnership appears on a random forum or YouTube video, treat it with extreme skepticism until it is corroborated by multiple independent, reputable sources.
Building a 2026 market strategy
A 2026 market strategy for Ethereum should prioritize infrastructure resilience over short-term price speculation. The network’s value is rooted in its utility as a settlement layer, not just its trading volume. This approach requires a disciplined focus on on-chain fundamentals and protocol upgrades.
Start by tracking key development milestones. Ethereum’s roadmap relies on continuous technical improvements, such as data availability optimizations and scaling solutions. These upgrades reduce costs and increase throughput, directly supporting long-term adoption. Monitor official Ethereum Foundation updates for reliable progress reports.
Use live data to ground your strategy in current reality. Instead of chasing daily price swings, observe network health metrics and developer activity. These indicators provide a clearer picture of Ethereum’s trajectory than speculative sentiment.
No comments yet. Be the first to share your thoughts!