The ETH Conspiracy framework
When people talk about the "ETH conspiracy," they aren't usually discussing a shadowy cabal of developers. They are referring to the invisible architecture of value extraction and scaling that powers Ethereum. This framework is defined by three structural pillars: Layer 2 scaling, Maximal Extractable Value (MEV), and institutional adoption. Understanding this interplay is essential because traditional analysis often misses the hidden costs and rewards embedded in these protocols.
Layer 2 scaling, particularly through ZK-Rollups, moves transaction execution off the main Ethereum chain to reduce fees and increase speed. While this improves user experience, it fragments liquidity and complexity. Simultaneously, MEV—the profit miners or validators can make by reordering, including, or censoring transactions—remains a central economic force. It is not merely a bug but a feature of the current consensus mechanism, often incentivizing sophisticated bots to arbitrage price differences across decentralized exchanges in milliseconds.
Institutional adoption adds another layer of opacity. As large entities enter the ecosystem, they utilize these same Layer 2 networks and MEV strategies, often blurring the line between organic market activity and structured financial engineering. This convergence creates an environment where price action is increasingly driven by infrastructure mechanics rather than simple supply and demand narratives. To navigate this, we must look beyond the chart and examine the tools that reveal these underlying flows.
Layer 2 infrastructure comparison
Choosing the right Layer 2 (L2) for your research requires understanding the trade-offs between speed, cost, and security. Ethereum’s scaling roadmap relies on two dominant architectural approaches: Optimistic Rollups and Zero-Knowledge (ZK) Rollups. While both aim to lower fees and increase throughput, they achieve this through fundamentally different mechanisms.
Optimistic Rollups, like Arbitrum and Optimism, assume transactions are valid by default and only run computation when challenged. This makes development easier but introduces a seven-day withdrawal delay for security. ZK-Rollups, such as zkSync and StarkNet, generate cryptographic proofs that verify every transaction instantly. They offer faster finality and stronger security guarantees but require more complex computational resources to generate those proofs.
The table below compares the core infrastructure metrics that matter for high-stakes analysis. We focus on throughput, average costs, and the underlying security model rather than abstract theory.
| Rollup Type | Throughput | Avg. Fee | Finality | Security Model |
|---|---|---|---|---|
| Optimistic (Arbitrum/Optimism) | 1,000–4,000 TPS | $0.01–$0.10 | 7 days (challenge window) | Economic staking + fraud proofs |
| ZK-Rollups (zkSync/StarkNet) | 2,000–10,000+ TPS | $0.001–$0.01 | Minutes (proof verification) | Cryptographic proofs (ZK-SNARKs/STARKs) |
| Hybrid (Scroll/Mantle) | Variable | Low | Minutes to Days | Mixed ZK + Optimistic |
The choice often comes down to your need for speed versus certainty. If you are building an application that requires instant user feedback, ZK-Rollups are increasingly the standard. However, for complex smart contracts that are harder to prove cryptographically, Optimistic Rollups remain the more developer-friendly option. As the ecosystem matures, hybrid models are emerging to balance these needs.
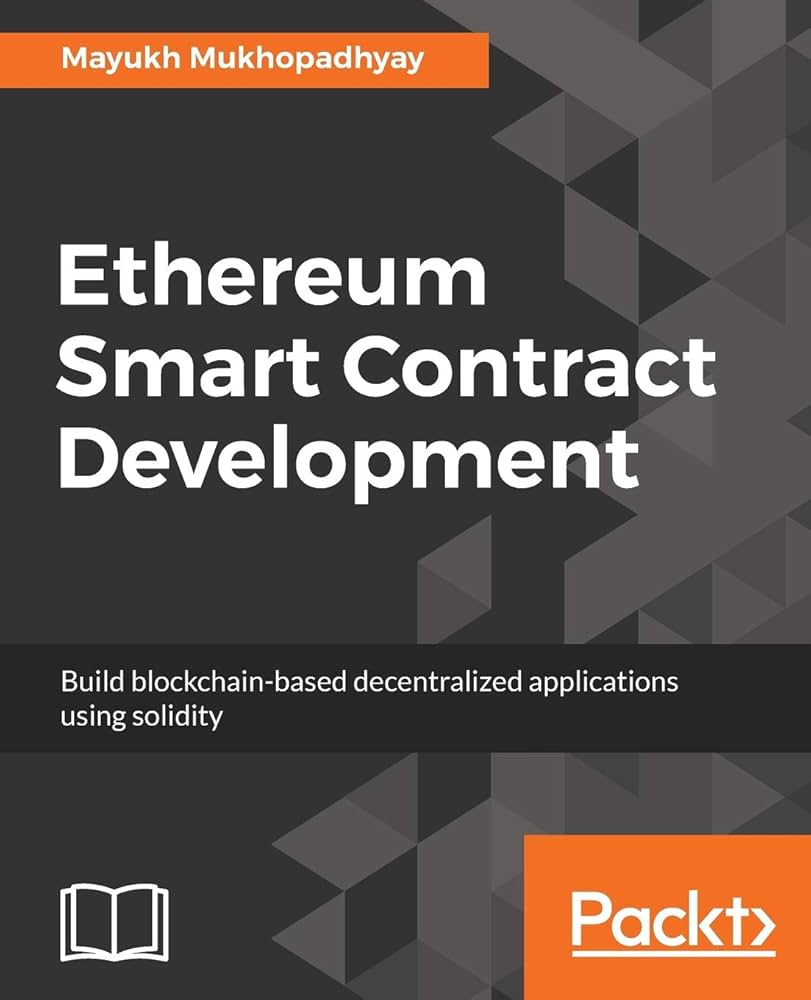
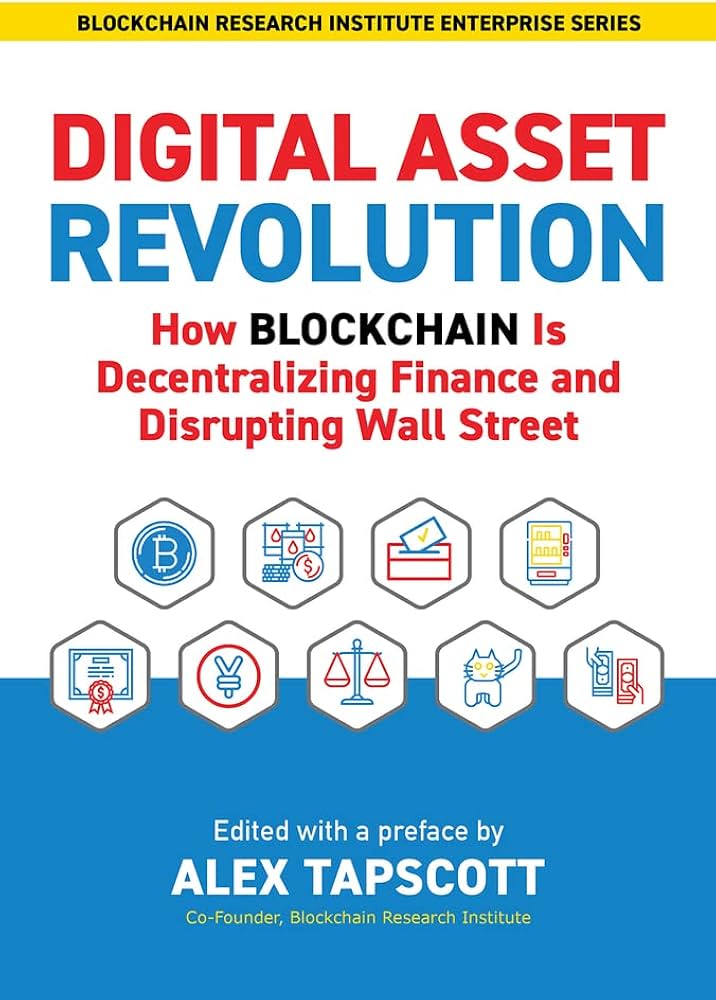
For those looking to track these networks in real-time, having the right analytical tools is essential. Below are some recommended resources for monitoring L2 performance and transaction data.

As an Amazon Associate, we may earn from qualifying purchases.
Ultimately, the "best" infrastructure depends on your specific use case. For high-frequency trading or real-time data feeds, ZK-Rollups offer the speed necessary. For complex DeFi protocols requiring extensive smart contract functionality, Optimistic Rollups provide the necessary flexibility. Keep an eye on hybrid solutions, as they may offer the best of both worlds in the near future.
On-chain tools for market research
Tracking the flow of Ethereum requires more than watching a price ticker. You need to see the plumbing. On-chain analytics tools act as the surveillance cameras for the blockchain, revealing where whales are moving funds, how protocols are performing, and where smart money is positioning itself. For a high-stakes environment, relying on public data is non-negotiable.
Dune Analytics
Dune Analytics is the go-to for custom SQL queries. If you want to track a specific wallet cluster or monitor the real-time volume of a new DeFi protocol, Dune lets you build dashboards from scratch. It is less about pre-packaged insights and more about raw, customizable data access. This makes it ideal for researchers who need to verify claims or dig into granular transaction details that general dashboards miss.
Nansen
For those who prefer curated intelligence over raw code, Nansen labels millions of wallets. It distinguishes between "smart money"—active, profitable traders—and retail noise. The platform highlights token flows and tracks the behavior of top-performing wallets. This labeling system allows you to see if a price surge is driven by genuine accumulation from sophisticated actors or just retail FOMO.
Glassnode
Glassnode specializes in macro-level on-chain metrics. It provides standardized indicators like exchange net flow, active addresses, and realized price. These metrics help contextualize where the market sits within broader cycles. When combined with live price data, Glassnode helps filter out short-term volatility to reveal the underlying health of the network.
Technical analysis for ETH
Ethereum’s technical picture in 2026 is defined by its relationship with Bitcoin rather than isolated price action. The ETH/BTC ratio has been the primary indicator for directional bias, revealing whether capital is rotating into smart contract platforms or staying in the reserve asset.
The chart above tracks the ETH/USD price alongside volume and RSI indicators. Watch for divergence between price highs and volume spikes; declining volume on rallies often signals weak institutional conviction. Support levels hold only when volume expands on the dip, confirming genuine accumulation rather than short-term speculation.
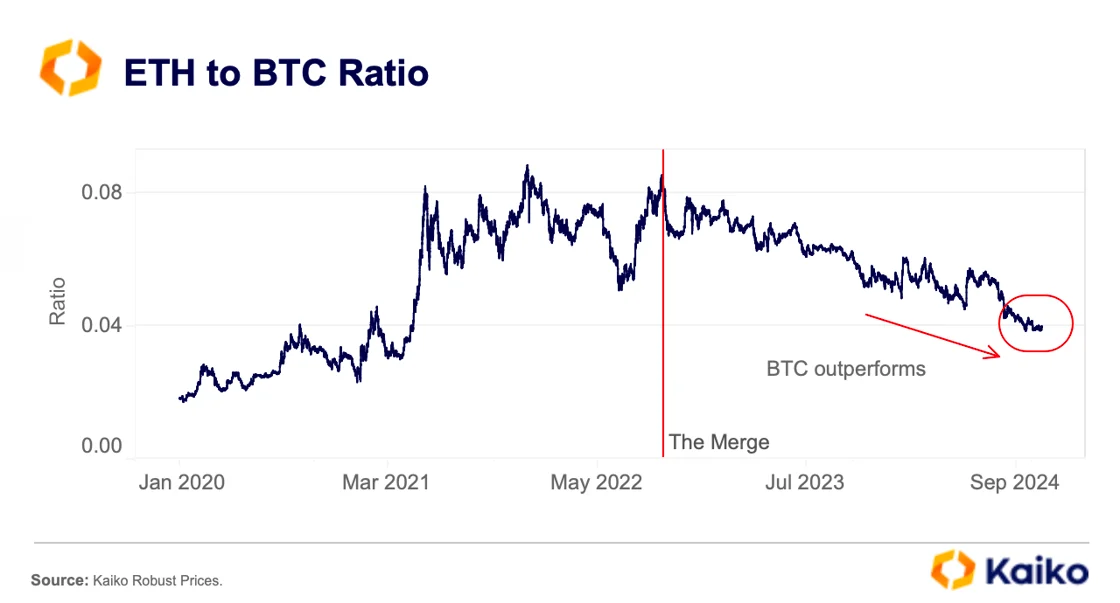
The ETH/BTC ratio chart from Kaiko illustrates the relative strength of Ethereum against Bitcoin. When this ratio breaks key moving averages, it often precedes a broader market cycle shift. A breakdown below the 200-day moving average on this pair typically signals that altcoins are underperforming, regardless of ETH’s absolute USD price.
Volume trends remain the most reliable confirmation tool. High volume on up-days validates support levels, while low volume on down-days suggests weak selling pressure. In the 2026 market cycle, institutional flows are increasingly visible in these volume profiles, making them more significant than retail-driven price swings.
Build your research workflow
A trading thesis is only as strong as the data behind it. To move from speculation to evidence, you need to assemble a stack of tools that covers on-chain activity, market liquidity, and macro context. This workflow ensures you aren't just reacting to price action, but understanding the infrastructure driving it.
Start with Etherscan or Blockscout. These are your eyes into the ledger. Track large wallet movements, token approvals, and gas fees. This raw data reveals where institutional money is flowing before it hits centralized exchanges.

Use a live widget to track ETH against BTC and stablecoins. Liquidity shifts often precede volatility. Watching the ETH/BTC ratio helps you gauge whether Ethereum is outperforming the broader crypto market or lagging behind Bitcoin's momentum.
Monitor Total Value Locked (TVL) and active addresses. High activity with low price appreciation can signal accumulation. Conversely, dropping active users while price holds might indicate a lack of genuine adoption despite speculative interest.
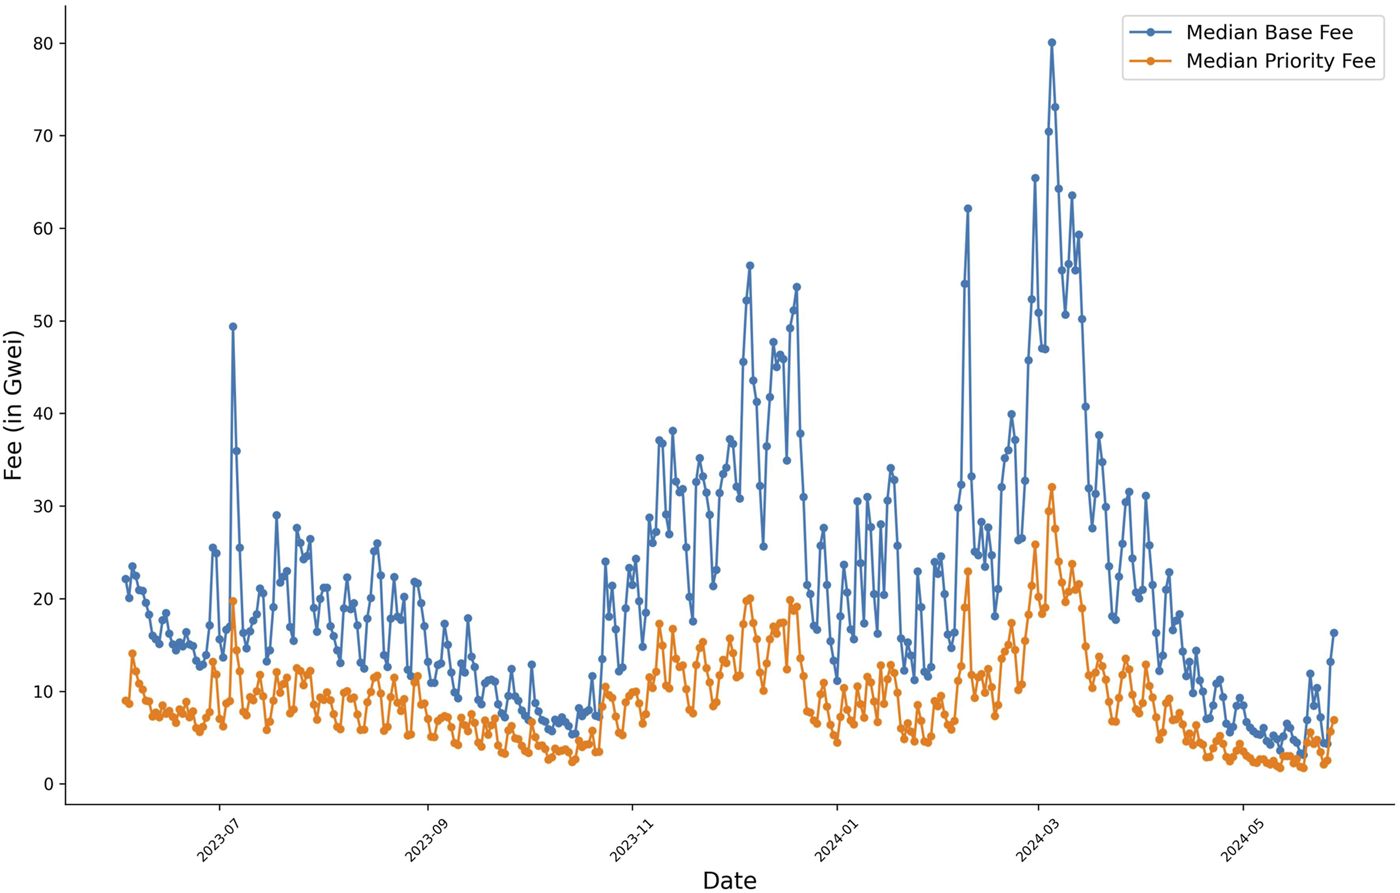
Combine on-chain data with technical charts. Look for divergences—for example, if price makes a new high but on-chain volume declines, the trend may be weakening. Document your findings in a structured format to maintain objectivity.
By following this sequence, you create a repeatable process. You stop guessing and start validating. The goal is to have a dashboard that updates in real-time, giving you the confidence to act when the data aligns with your strategy.
Common questions on ETH infrastructure
Users often worry about L2 data reliability. The core issue is data availability. L2s post compressed data to Ethereum mainnet. If the mainnet is secure, the L2 history is verifiable. This setup ensures that no single operator can forge transactions without detection.
The Ethereum Foundation guides this process through policy and research. Their latest policy guide outlines use cases for institutions. It clarifies how L2s fit into regulated financial systems. This guidance helps developers build compliant infrastructure.
Understanding these mechanics is essential for high-stakes finance. Reliable data is the foundation of trust. Always check the official policy documents before deploying capital.
No comments yet. Be the first to share your thoughts!